
Simple network health evaluation – to simplify diagnostics

Network evaluation to meet a desire application use is very challenging and daunting task for anybody; user, engineer, IT and telco operator alike. The main reason is the need for precise network measurement tools on one hand and then the knowhow of delivery protocols and how will they behave in such network conditions.
Let’s start with measurements, most network measurements like packet loss, jitter, latency, RTT and bandwidth are accomplished with old and traditional tools like Ping, SpeedTest, Iperf, TraceRoute and their more sophisticated offspring. But the common issue to all is the sampling period which is one packet every few seconds. This way constant interferences and delays can be reported, but transient events are missed out completely. To overcome this limitation there is a need for a more precise and higher frequency sampling method to gather these KPI and make them available to the user. As a minimum the KPI will include information on jitter, error rate, latency, RTT and network availability.
The next hurdle is overcoming the knowledge gap, new and old protocols need to be learned and educated across the organization. The protocol needs to be compared against network KPI to evaluate the network ability to sustain the desired application and delivery protocol. For example, if the network exhibits 45% packet loss a TCP protocol will behave poorly on such network or a network with latency of 2sec will not deliver a low delay uncompressed video signal.
The question is then – are we going to be subjugated by the KPIs and need highly trained IT people as a knowledge base? Is there a simple way to simplify the information?
This is exactly what we sought to achieve with Delivery Performance Score ( DPS ). We thought to ourselves how can we consider the ad hoc KPI and run them through a subjective formula to come up with a grade. Such grade should be easy to understand to all users ( low level operators, engineers, operation, architects and management ) and also trace back the root cause of a problem.
We understood that each protocol has its unique limitations on Jitter, packet loss, latency, RTT and availability. Each may have a different area of sensitivity, for example If I am running SRT protocol, I would not like my Error rate to exceed 10% and have enough RTT to do several retransmission requests. Each KPI also may carry a different weight against others. We started by defining boundaries; area which is acceptable ( Green ), area which show trouble ( Orange ) and anything below which is trouble ( RED ). After long work with Subjective value crunching for every KPI and producing a Grade for each value in a format of a Look up table, we turned to ChatGPT to evaluate the numbers and suggest mathematical equation that was able to give us the necessary Green, Orange, Red areas and grade.
Now we combined these multiple formulas of KPI with assigned weights to produce a grade in the range of 100 to 0. With 100-90 being Green, less than 90 and up to 80 being Orange and less than 80 being RED. The formula component sometimes compensates and provides tolerance to transient events to allow a combined grade.
Now we have a simple method for users to better understand the network behavior, one number to rule them all and a color. This way a low-level operator can look for only one thing – a Green indicator to understand that all is within boundaries, an orange is something that needs my attention and RED calls for action. The same information can be provided up the responsibility chain. Alarming becomes easier to maintain – look at one grade and assess what causes a trend.
Example for error rate:
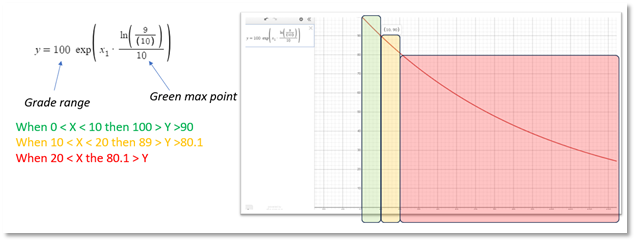
The formula gave as the ability to define only the GREEN lower range and immediately it also computed the lower ORANGE value.
What are the benefits: Decision making becomes easier and faster, the learning curve becomes easier, less alarms to store and process.
The user can use the grading method to any protocol or application.