Simplifying Transport Stream Delivery Health Monitoring with Delivery Score

Simplifying Transport Stream Delivery Health Monitoring with Delivery Score
Transport Stream Delivery Health and Personal Health are not that different, from an analytical perspective. Both require years of education and benefit from years of experience. But the first is specific to engineers while the latter applies to medical professionals. Diagnosing problems in either Transport Stream delivery or Personal Health is very hard and is conducted by applying multiple layers of diagnostics, or what are otherwise referred to as Key Points of Interest ( KPI ). Let’s use a very common example – blood tests. Most of us tend to conduct a regular blood test once or twice each year. But most of us don’t understand the resulting report, nor do we see the correlation between the different recorded measurements. For those determinations we look to a doctor to interpret the results and guide us on how to stay healthy and things to avoid. The same example applies to ECG (electrocardiogram) measurements, that these are not easily understood by untrained people.
How do we simplify the interpretation of real-time data network measurements? How do we correlate bit error rate (BER), round trip time (RTT), Packet Jitter and Packet Latency? Which measurements are more important and how do they influence each other? The traditional method is to apply simple alarms and combination of alarms – but they only notify the user is that an event is occurring. It is up to the user to determine if there is a correlation leading to a cause. Consider the last time you observed an event with multiple alarms. You had to investigate the correlation between the alarms and attempt to determine the root cause and the resulting impact on the application service – this is a daunting task and calls for highly trained engineers, IT professionals, and experienced staff.
AlvaLinks has addressed this problem directly by creating the Delivery Performance Score ( DPS ). The DPS is a scoring method that considers multiple, real-time Key Points of Interest (KPIs) by assigning weights to recorded metrics to determine a specific scoring value. For each KPI there are three ranges: Good, Acceptable, and Poor
Good – Any value between 100 to 90
Acceptable – any value between 89.9 to 80
Poor – Any value below 79.9
The outcome of each KPI is run through a weighted formula to produce a combined Delivery Performance Score.
The DPS is a simple value that is continuously evaluated against real-time measurements. The user training therefore becomes simpler because the user does not need to be an IT or Engineering professional to understand the details behind the DPS value. This also implies that users need only monitor only one value, even further simplified with a color grading; Green, Orange, or Red. When the DPS is in the Green, the path is fine for application delivery. If the DPS turns Orange, this calls attention to a situation that should be monitored. If the DPS turns Red, the user should call an Engineer or IT Supervisor.
The operator can also create a single alarm that includes multiple KPIs with built in weights and values between multiple KPI’s. Not every event will cause the score to drop, but some may be regarded as more critical and will push the score down for the user to take immediate action.
How was this scoring method determined?
This began with a subjective evaluation based upon 20 years of practical field experience accumulated by the Alvalinks CTO. A look up table was compiled for each KPI. The resulting table was then analyzed by ChatGPT to determine a mathematical formula that allows use of a single-entry range to calculate the Good, the Acceptable and the Poor Delivery Performance Score. The accumulated outcome of each KPI is then applied to a weighted formula.
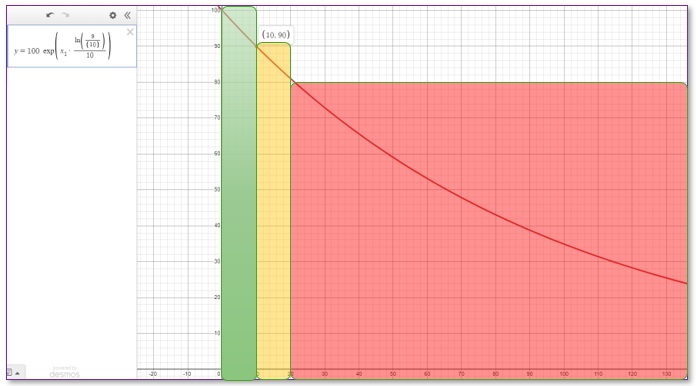
Note the formula for one KPI on the top left corner.
The outcome can also be applied to a chart for consideration over time:
One can see the score passing through the Green area and Orange area while in this example Red values were not recorded and therefore are not displayed in this capture. Two individual lines are present and charted; the ad hoc immediate value and the average value over time.
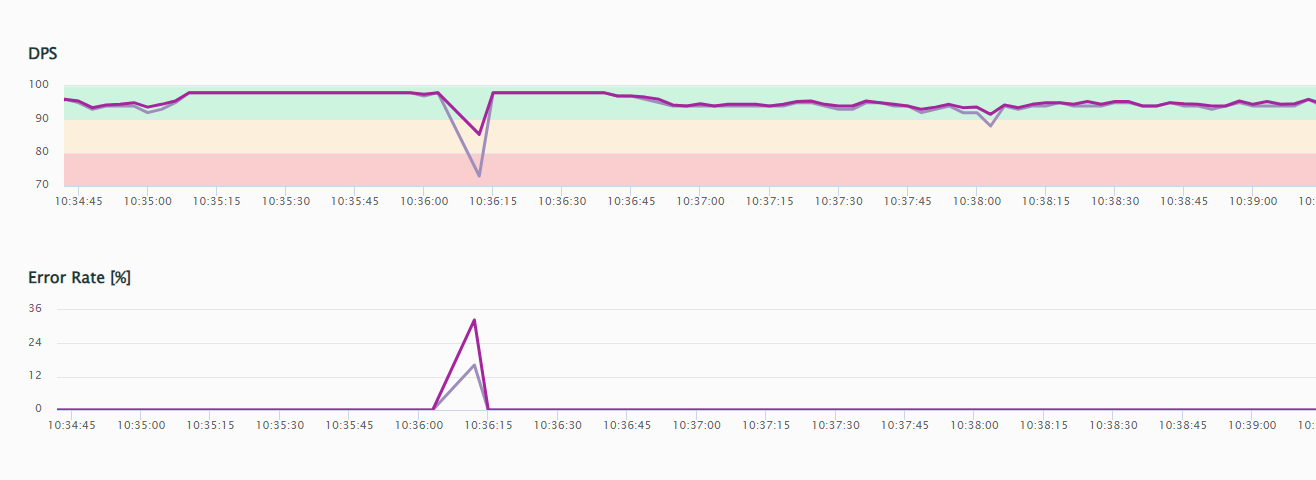
Below is a real-time example demonstrating a single connection carrying several SRT streams, each with a 1000ms latency buffer. Attention should be given to the chart at the top.
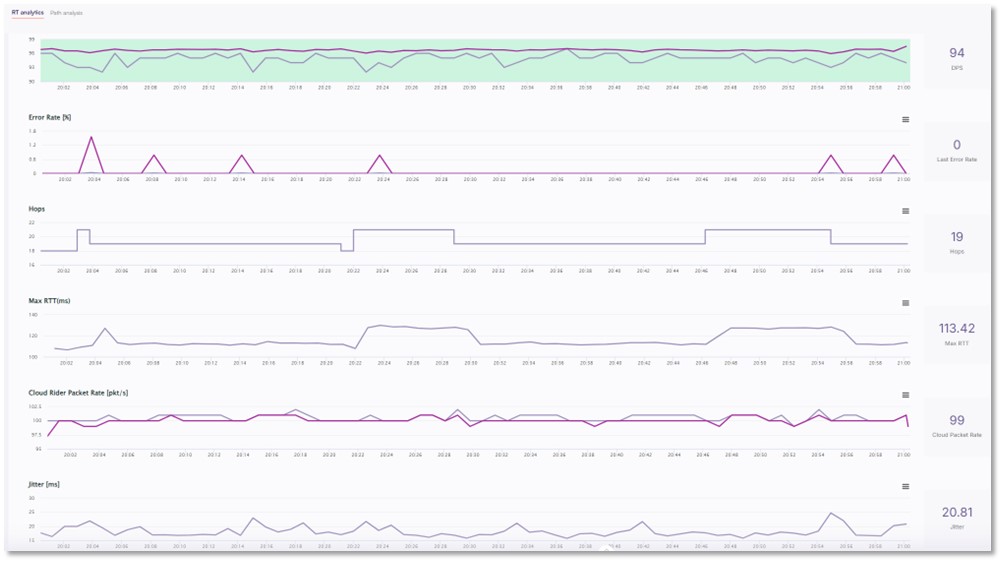
The SRT protocol can overcome packet loss of at least 8% so the resulting value does apply a significant weight on the DPS score. The DPS remains in the Good range above 93. The same is true with the occasional RTT increasing to 130ms. The operator determined such value acceptable for a 1000ms latency buffer (using X6 RTT multiplier as recommended by Haivision https://doc.haivision.com/additional-resources/rtt-multiplier ). The Jitter is also within the acceptable range.
Why is this important?
By applying use of the DPS scoring method, the requirements of an advanced skill set, experience, or the knowledge level of the operational teams or the field technicians are reduced. Trained engineers, IT professionals or streaming experts to monitor transport paths with the knowledge to understand all the bits, bytes, and combined influences are not required at the monitoring and surveillance level. The AlvaLinks CloudRider application enables less skilled users to be trusted with the observation and monitoring responsibilities.
The users and operators now only need to monitor a single value or chart. As a result, the organization will then spend less time reviewing alarms and interrogating heavy lift events. This is money saved for the department, the operation and the organization. The organization experts will still be responsible to set the necessary value for each KPI (as they do with traditional alarms) and investigate deeper when a situation turns Red and requires further evaluation. But the time saved to pinpoint the source of a problem can now be applied to other organizational requirements. The result is time and cost savings for all !