
In‑Flight SRT Probing: What It Is and Why It Changes Everything
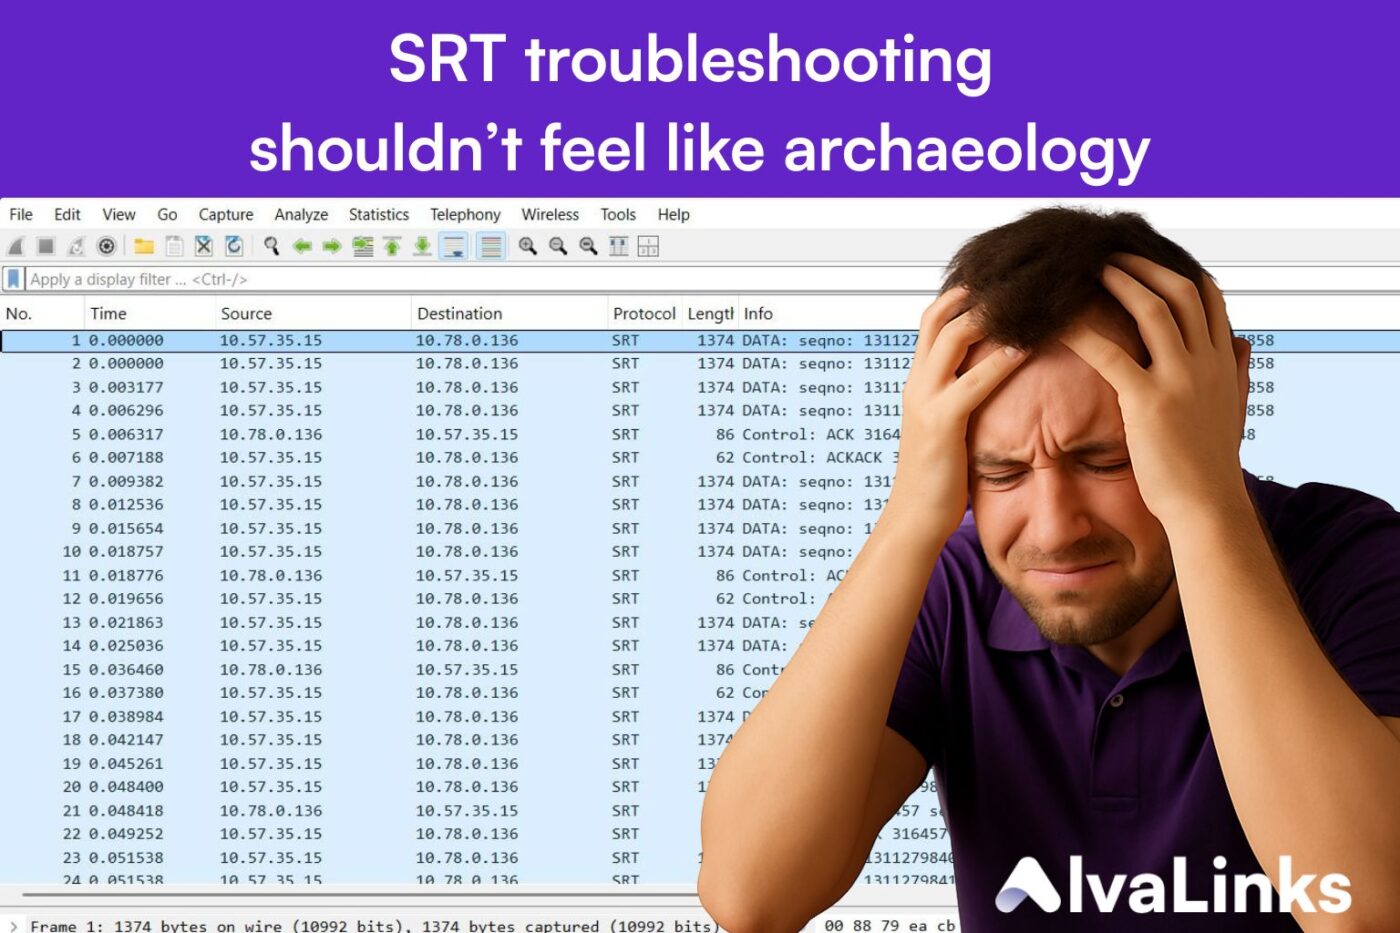
If you have ever stared at ten thousand SRT packets capture analysis, trying to spot the single retransmission storm root cause that killed the feed, you know the pain. SRT is brilliant at punching through shaky networks, but its control messages need a lot of knowledge and technical expirence to understand the control session messaging between the SRT peers handshakes, ACK, ACKACK, and latency buffers. This knowhow turns SRT event troubleshooting into archaeology dig in to control and data packet sessions that will scare Indiana Jones more than snakes. With Wireshark SRT dissector life may become easier, but Packet captures help after the fact. In‑flight probing helps while the stream is still live.
1. Quick definition box
| Term | Plain definition |
| SRT | Secure Reliable Transport – UDP‑based protocol that adds encryption and ARQ retransmits. |
| Dissector | A parser that turns raw packets into readable fields (e.g., Wireshark plugin). |
| In‑flight probing | Active measurement inside the running SRT session – no decode needed. |
| ARQ storm | Burst of retransmitted packets in a reaction to NAK messages from the receiver. Such storms can break down the streaming session. |
| Data packet | A packet containing data payload and identified as such with a particular data flag |
| Control packet | A packet containing control message between the two peers of several sub messages and identified as such with a particular control flag. |
Pin these six on your whiteboard. The rest of the article will keep circling them.
2. Why classic packet capture comes up short
Wireshark’s SRT dissector is a heroic open‑source effort, but it shows each packet in isolation. A ten‑minute UHD contribution feed generates 18 million packets. Even if you filter ARQ storm starting point -, you still have to eyeball timestamps, detect the NAK messages causing the storm, read RTT, evaluate Buffer occupancy and guess where the decoder buffer collapsed. A complete list of filter SRT dissector options can be found : https://www.wireshark.org/docs/dfref/s/srt.html .
Note that Packet captures are also passive: you spot the issue after the feed is ruined and it is the next recurrence of the event which you hope to capture.
3. What in‑flight SRT probing does differently
- Hooks into the live feed – no PCAP filters.
- Real-time capture – all the data is captured and processed. Metrics are extracted in 1 sec.
- Visualizes the metrics and data as a simple timeline chart, see ARQ packets in action
- Real-time score – – green, yellow, red and use AI to explain to you events that even non‑engineers get.
- Link vs flow – correlate flow performance ( with error recovery ) to a link ( not error recovery )
- SRT vs Route – see how the route performs
- History – store severals SRT session of several days
Think of it as a cardiogram for your stream rather than an autopsy report.
4. Head‑to‑head: Wireshark dissector vs AlvaLinks probe
| Feature | Wireshark SRT dissector | AlvaLinks in‑flight probe |
| Deployment | Laptop on a mirror port | Lightweight agent on source or destination |
| Data volume | Full PCAP – GB per minute | Compressed metrics – kB per minute |
| Time granularity | User chosen filter, manual | 1sec view |
| RTT trend | Manual delta calculation | Auto chart, instant |
| ARQ alert | None | Threshold |
| Bitrate alert | Not available | Threshold |
| Jitter alert | Not available | Threshold |
| Path change | Not available | Threshold |
| Error rate alert | Not available | Threshold |
| RTT Alert | Not available | Threshold |
| Latency alert | Not available | Threshold |
| #HOP alert | Not available | Threshold |
| Score alert | Not available | Threshold |
| Actionability | Post‑mortem | Real‑time alert, before viewer impact |
The dissector is great for protocol developers. Broadcast engineers and Architects need to focus on right column
5. Real‑world example
During the NAB remote production demo, a 4K feed crossed two ISPs and a cloud ingest. At minute 22:
- Route change added 18 ms one‑way delay.
- SRT latency mode could absorb 16 ms only.
- Probe flagged retransmit ratio climbing from 0.2 percent to 1.8 percent over 30 seconds.
- Operator added 150 ms buffer on the fly. Viewers never saw a glitch.
The PCAP review later confirmed the same story but took two hours to decode. The probe identifiedit in sixty seconds – live.
6. Deeper visibility into SRT internals
In‑flight probing reveals:
- Handshake outliers – when initial RTT is already too high to your application and latency buffer setting
- Latency creep – rising base delay that eats buffer margin.
- Jitter performance – earliest indication of problematic event
- Error spikes – beyond the number of retransmissions
- Route change – cause SRT session change and buffer flush
- Flow spiking – early indication of a congestion
- Flow errors – ARQ may not be able to recover all lost packets – indicates a smaller latency buffer or low #of re-transmision
- ARQ with no link errors – indicates ARQ as a result of re ordered packets or jitter > ½ RTT
- HOP response time correlation to events – indicate which HOP is causing disturbance
- Score of the real time statistics – indicates when SRT metrics falls below and accepted criteria set by the operator.
- Per‑direction stats – asymmetric loss that Wireshark cannot see without dual captures.
Engineers get numbers they can act on, not hex dumps they must decode.
7. What this means for your playbook
- Before a live event
Run a 180‑second probe, capture baseline jitter, RTT, Error rate – set buffer accordingly. Validate the route provider. - During the show
Keep the probe streaming metrics. Alert on retransmit ratio spike – add buffer or select an alternative session. - After the show
Use the stored metrics to negotiate SLAs with carriers – you now have evidence.
A task that once required two analysts and a packet slicer is now one chart anyone can read.
8. Questions we hear every week
Will the probe add load to my link?
No. it taps to the SRT stream, we add a few packet overhead to map the route performance
Does it expose my encrypted video?
No. The probe touches only headers data, never payload.
Can’t I script this in Wireshark?
You could, but maintenance, scaling, and real‑time dashboards turn into a second project. Most teams would rather spend those days on content, not code.
Conclusion
SRT is open-source but comes with a complexity by design. Most users don’t master the control messages and the correlation between the packets and the outcome – leave that to the vendors. Diving into the wireshark should be your last course of action – be ready to waste days.
In‑flight probing turns the protocol’s black box into a live dashboard engineers can steer by. Think of it as upgrading from Morse code to a heart monitor. Once you use it, packet captures feel like chiseling stone tablets.
Ready to see your SRT flow’s heartbeat?
FAQ snippet – ready for search
What is in‑flight SRT probing?
Active measurement that taps to a live SRT session, sampling latency, jitter and retransmit stats in real time without full packet captures.
How is in‑flight probing better than Wireshark for SRT?
Wireshark provides after‑the‑fact packet analysis. In‑flight probing delivers millisecond‑level metrics and alerts as the stream runs, letting engineers fix issues before viewers notice.
Is in‑flight probing hard to deploy?
No. Install a lightweight agent on the source or destination host and start a probe with one command. It adds negligible overhead and needs no span ports.