The Situation
An enterprise application intermittently slows down when accessing a cloud service. Users complain that the system freezes or becomes unresponsive for 30 to 60 seconds. After that, everything returns to normal. This happens several times a day.
Operations teams escalate the issue. Business users complain. Revenue and productivity are affected. IT teams check their dashboards. All network tools report normal latency, minimal packet loss, and full availability. From the network point of view, everything is fine.
This disconnect is the reality of modern networks.
Circuit providers or Telcom operators rely on OAM tools to ensure network SLAs and to alert when network performance falls short.
Why Traditional OAM Tools See “No Problem”?
Classic network OAM tools such as Y.1731, RFC2544, and TWAMP were designed for stable, deterministic networks. The gap can be summarized simply: Y.1731, RFC2544, and TWAMP are great at producing point metrics. They fall short when the network behaves like a modern distributed system, where performance problems are intermittent, path-dependent, and caused by interactions across domains. In such environments, correlation is the difference between “we saw a symptom” and “we found the root cause”.

Where the classic OAM tools fall short
Y.1731
Y.1731 was designed forEthernet OAM inside a controlled L2 domain. Continuity checks, delay, loss, and SLA verification on a defined service. It is ideal for testing the network before going to live production or during maintenance windows. However, it falls short in domain boundaries: it relies on full end-to-end ownership and control of the Ethernet service. It struggles when the path crosses ISP, cloud edge, SaaS, SD-WAN overlays, and Internet segments. The measurements are path-targeted, i.e., the user must be aware of and identify the problematic path to perform testing and SLA verification. It measures “the service” but cannot determine which physical or logical path carries the traffic now, or causes degradation. Critically, it cannot correlate delay spikes to routing decisions, ECMP hashing changes, transient queue buildup, or middle-mile impairments.
RFC2544
RFC2544 is a welcome evolution of Y.1731, introducing L3 capabilities to improve SLA visibility. It comes with benchmark testing. One-time or scheduled tests to validate throughput, loss, and latency under controlled conditions.
The limitation is structural: benchmark traffic patterns rarely match production characteristics, including packet sizes, burstiness, timing, and flow distribution, which differ significantly. More problematic, RFC2544 provides snapshot measurements. An intermittent issue lasting 30 seconds per day can easily fall outside the test window. Even when tests detect degradation, RFC2544 delivers pass/fail test results without the path awareness and correlation needed to identify which element or segment is at fault.
TWAMP
TWAMP was designed to test and extract key metrics, including RTT, Packet loss, Latency, and jitter, between two points. This enables IP-layer active measurement at scale, latency, and loss trending between endpoints for SLA reporting. The problem: TWAMP reports aggregate statistics. If 99.9% of packets traverse healthy paths while 0.1% hit a degraded ECMP member, TWAMP shows “mostly healthy” while specific application flows experience significant impairment. Standard TWAMP probes do not replicate 5-tuple characteristics of production flows, meaning probes may hash different ECMP paths than the affected traffic. TWAMP measures performance but provides no mechanism to track path changes or hop-by-hop performance. This is a major blind spot, as no explanation is given for the change in performance.
Why correlation is mandatory
Modern incidents are rarely single, permanent failures. They are “gray failures”. Intermittent, partial, path-specific, and often invisible to uptime monitoring.
Root cause analysis requires answering all four questions at the same time:
- How traffic was affected by evaluating KPI (Loss, delay, jitter, etc.).
- Which path did the traffic take at that moment?
- Which segment introduced loss, delay, jitter, reordering, or retransmissions?
- Whether the change was driven by ECMP, a load balancer decision, congestion, access network behavior, cloud edge scaling, or policy.
Classic OAM tools can usually provide only one of these dimensions. They do not stitch them together into a defensible causality chain. It becomes a time-consuming manual effort to determine where and how it happened. But the problem lingers while you try to figure it out. AI was introduced to tackle this issue, but it is based on an Alarm, log, and metrics study that is just too slow and may also lead to hallucinations.
AlvaLinks detects ECMP, and load balancers are often not detected by legacy OAM tools
The core problem: ECMP and load balancers create multiple valid paths. Many legacy OAM approaches assume a single, stable path, or they probe in ways that do not reliably mirror the path taken by production traffic.
Common failure modes:
- Different hashing input: probes that do not match the application’s 5-tuple can be hashed to a different ECMP path than the real flow. You measure a healthy path while the application is on a degraded one.
- Per packet or per flow load balancing: some environments switch paths dynamically. Traditional OAM sees “a result” but cannot bind the result to the exact path used at that instant.
- Policy and overlays: SD-WAN, cloud routing, NAT, and service meshes can rewrite headers. Classic tools lose the path’s identity and cannot map symptoms to the correct segment.
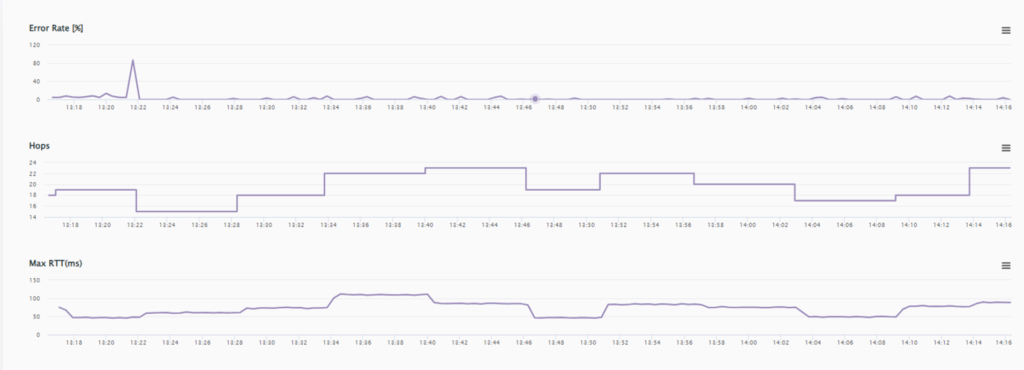
Figure 1 – RTT changes for each route change
Figure 1 shows an example of frequent path changes, identified by changes in the TTL (hop count) value and the impact of each hop on the RTT (worse/better), along with the associated error introduced by the change.
How AlvaLinks Solves What Legacy OAM Cannot
AlvaLinks takes a fundamentally different architectural approach: flow-realistic measurement combined with path visibility, correlated in time.
Flow-Aware Probing
Unlike generic ICMP or UDP probes that use a single port number, AlvaLinks generates measurement traffic that matches the 5-tuple characteristics of production application flows. This ensures probes hash to the same ECMP paths and receive the same load balancer treatment as real traffic. When Path A is healthy, but Path B experiences microbursts, AlvaLinks detects the divergence because its probes use the same hashing logic as the affected flows.
Per-Hop, Per-Segment Visibility
AlvaLinks decomposes end-to-end measurements into per-segment metrics by tracking the performance of each hop. End-to-end RTT and latency measurements can then be compared at each hop to identify where the performance issues occur: the middle mile, the cloud edge, or the provider interconnect. When degradation occurs, the platform allows fast correlation of the specific segment responsible.
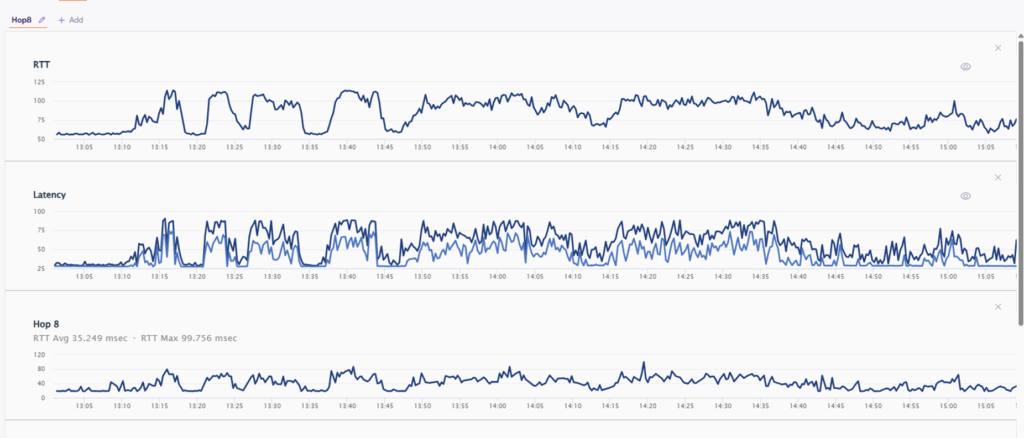
Figure 2: AlvaLinks shows the correlation between RTT, Latency to specific HOP
Figure 2 shows end-to-end RTT and Latency impacted by a specific hop, demonstrating a 1:1 correlation.
Temporal Correlation Engine
AlvaLinks continuously correlates KPI measurements with path selection events. When Packet loss occurs and latency spikes, the platform allows rapid correlation with an ECMP path change, a load balancer decision, a routing update, or a capacity event. This transforms isolated metrics into causal chains: “RTT increased 40ms when flow shifted to Path B; Path B shows 2% loss in middle-mile segment X during peak hours.”
Path-Anchored Analysis
Every measurement in AlvaLinks is bound to the actual path traversed at the time of measurement. This eliminates the fundamental ambiguity of legacy tools, where probes may travel different paths than production traffic. Operators see performance metrics anchored to real topology, not abstracted averages disconnected from traffic behavior.
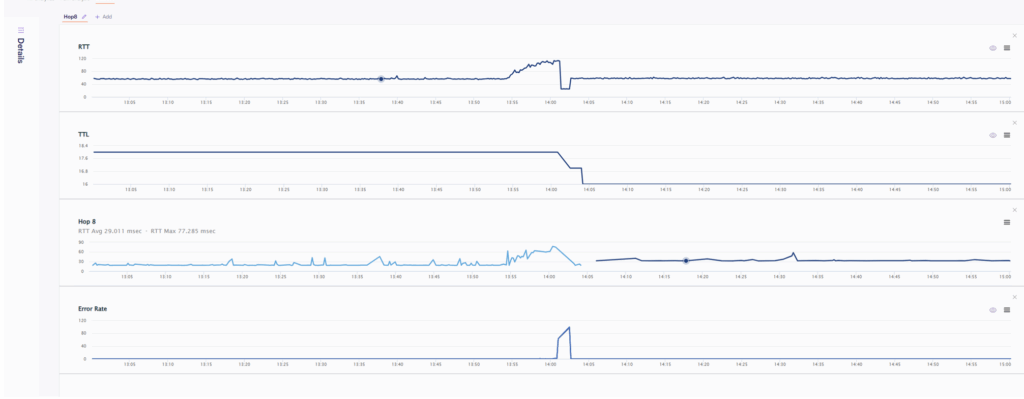
Figure 3 – Route change causing packet loss
An example that makes the difference obvious
Scenario
A global company uses CRM SaaS and voice meetings. Complaints happen daily. “Calls get robotic for 20 to 40 seconds”. “CRM freezes, then recovers”. The NOC dashboard shows 99.95% uptime.
What classic OAM reports
- TWAMP between sites and the cloud region shows that average latency is stable, and average loss is near zero.
- RFC2544 monthly test passes. Throughput is fine.
- Y.1731 inside the campus or metro Ethernet service shows the carrier SLA is met.
So, the conversation becomes: “No fault found”. Or worse: “It must be the SaaS” or better yet: “Bring me a Traceroute during the event”.
What actually happened?
Traffic to the SaaS is ECMP hashed across multiple upstream paths. One of the paths occasionally hits microbursts and packet loss in a middle segment during peak hours. When the flow hashes onto that path, voice and SaaS suffer. When it hashes away, everything looks normal. Done, no trace, no history – all evidence of the previous hash faded away. All that is left is a degraded application performance and the associated alarms with no reason.
What AlvaLinks shows
- Only the affected flows show impairment.
- The impairment correlates with a specific path choice. Example: path A is healthy; path B has periodic loss bursts.
- The event correlates to a specific network segment and time pattern. Example: middle-mile congestion between two providers, or a specific cloud edge pop at peak.
- You get a root cause narrative that an operator can act on. Reroute policy, provider tickets with proof, ECMP pinning for critical traffic, or capacity change at the right place.
That is the difference between arguing about symptoms and identifying the cause.
Commercial impact: Why should enterprises care?
For enterprise management, the value is not about “better metrics” but about reduced operational waste and protected revenue.
- Fewer revenue-impacting incidents: fewer abandoned calls, fewer failed checkouts, fewer customer support escalations.
- Shorter MTTR: correlation turns multi-day war rooms into targeted action. Less downtime of business processes.
- Lower blame cost: fewer circular escalations between ISP, cloud, and SaaS. Faster accountability because evidence is tied to the path and time.
- Higher productivity: fewer slowdowns that do not trigger outages but still drain hours across teams.
- Better vendor leverage: objective proof enables SLA enforcement and faster remediation.
- Reduced risk during growth: as you add regions, clouds, SD-WAN, and more ECMP layers, gray failures scale unless you have correlation-driven root cause capability.
Takeaways
The recurring pattern of application slowdowns followed by full recovery is not a mystery. It is a consequence of how modern networks operate.
Dynamic routing, ECMP, load balancers, cloud edges, cloud, and shared infrastructure introduce path diversity and variability that legacy OAM tools were never designed to explain.
- Traditional tools answer the question “Is the network up and within SLA on average?”
They do not answer “Why did this specific application fail at this specific moment?” - AlvaLinks closes this gap by correlating application experience, real traffic behavior, and actual path selection in time.
This correlation is the mandatory step from symptom monitoring to true root cause analysis.
For organizations that rely on cloud, SaaS, and real-time digital services, the choice is clear.
For organizations operating hybrid, multi-cloud, and SD-WAN environments, this is the architectural shift required to move from symptom monitoring to problem monitoring.
Either accept recurring gray failures as an unavoidable cost of modern networking, or leverage correlation-driven visibility to turn intermittent problems into solvable ones.