
ObservaNet
Your customers report a problem your dashboards insist isn't there
You call the connectivity provider. Nothing. You call the cloud provider. Nothing. Multiple teams join a bridge call, and none of them can prove where the fault actually lives. The tickets keep arriving.
ObservaNet resolves that standoff. It localizes the fault to the ISP, SD-WAN, cloud region, transit gateway, or a specific hop range, and provides evidence that a provider cannot deflect.
GRAY FAILURE
A recognized problem, with a name
The path is impaired. Every health check reports healthy. It is not operator error, nor is it a gap in your team's diligence. Microsoft's research team identified it in the cloud in 2017 and named it Gray Failure (Huang et al., Microsoft Research, HotOS 2017): a path or component the application experiences as broken, even though every health checks the system runs returns green. Any organization running business applications across the cloud and the data center, with connectivity that spans multiple providers and segments, is exposed to it. Most have already closed an incident of this kind, filed as "no fault found."
The problem is well understood. Detecting it in real time is a challenge.
THE COST
Two categories of impact, both reaching the P&L
Network impact
Gray failure. Partial impairment on an application’s data path. Aggregate metrics conceal it. Silent until it cascades into a full outage.
The AI traffic ramp. AI workloads behave differently from the client-server traffic networks that were engineered for. They are sensitive to sub-second delay and drive substantially higher east-west load, and industry projections place AI at half of enterprise traffic by 2030. The heuristics accumulated over prior decades will not hold through that transition.
Third-party blind segments. Your telemetry stops at your own edge. A fault inside a carrier, a transit provider, or a cloud region only shows downstream, as a symptom.
Operational and financial impact
Escalations that consume senior engineering time. A bridge call with six teams and no evidence resolves slowly. The same call ends fast when the segment, hop range, and carrier are known before it begins.
Mean time to repair is measured in weeks. The business absorbs the cost until the failure is caught in the act. ObservaNet typically shows an 80% to 90% reduction in MTTR.
Recurring third-party diagnostic spend. Organizations stop retaining outside specialists to locate faults that their own tooling cannot see.
Unenforceable SLAs. Show the provider path-anchored evidence, and the conversation moves from denial to a remediation plan.
Revenue exposure. Each item above carries a cost. An MTTR reduction of 80% to 90% returns measurable revenue to the P&L.
What ObservaNet is
ObservaNet is a software path-layer sensor platform. It detects subtle, multi-segment network failures in seconds and identifies where the fault lives, so teams mitigate user impact immediately and hand providers the concrete data required to act and meet their SLA.
It’s software only, with no hardware anywhere in the deployment. The sensors run on Linux or Windows hosts, stay vendor- and service-provider-agnostic, and augment the observability stack you already run rather than replacing it.
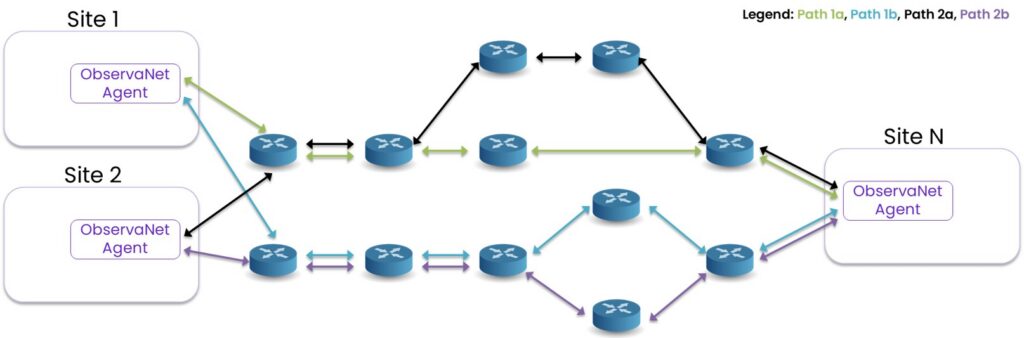
The score that makes high-frequency sampling actionable
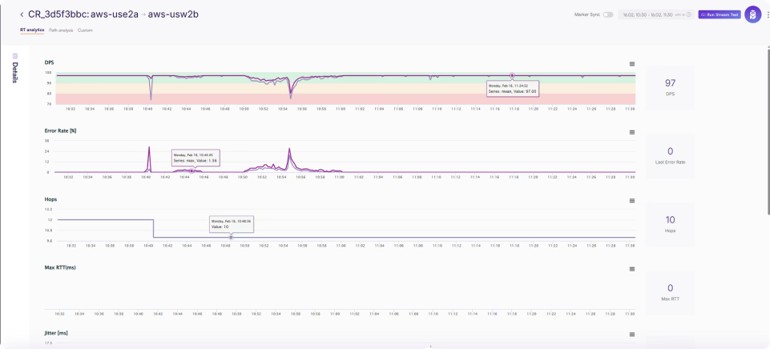
ObservaNet continuously samples a path up to 1,000 times per second. At that resolution, raw output would generate constant false positives. The Datapath Performance Score (DPS) is AlvaLinks’s algorithm that converts that sampling density into signal.
Tuned per application. Latency-sensitive trading traffic and a bulk data sync tolerate entirely different conditions. DPS is calibrated to each application’s KPIs, so it reports how the application experiences the path rather than how the link appears in the abstract.
Suppresses false positives. A breach of the composite score, and only that, triggers an evidence capture: the path, the segment, the KPI delta, and the offending hop range. The sampling gives you sensitivity. DPS keeps you from chasing noise.
The DPS algorithm considers RTT, delay, packet error rate, and jitter, with compound thresholds set per application.
What ObservaNet resolves that other tools cannot
Conventional tools report that “something looks wrong.”
ObservaNet identifies what, where, and which traffic is affected.
Total outage vs. gray failure
Partial impairment shows even when aggregate metrics look healthy.
Congestion vs. policing
ObservaNet tells capacity saturation apart from rate-limiting behavior, per flow.
Forward vs. reverse path
Not all impairments are symmetric; ObservaNet identifies which direction is degrading.
Flow-specific vs. path-specific
Establishes whether an issue spans the path or is isolated to a single flow.
ObservaNet recognizes 15+ signatures, including ECMP gray failure, microbursts, asymmetry, policing, MTU issues, blackholes, and route changes.
HOW IT WORKS
Four moves, one afternoon
Deploy
Software sensors at both ends. No hardware. Linux or Windows.
Instrument
Synthetic packets carry the same 5-tuple, size, and header format as your application traffic, and travel the same paths.
Detect
Per packet, sub-second, localized to the ISP, SD-WAN, cloud region, transit gateway, or specific hop range.
Correlate
RTT, delay, packet error rate, and jitter form the signature that names the failure.
Deploy as SaaS, on-premises for air-gapped or security-sensitive environments, or hybrid.
IN PRODUCTION
Uplynk use case
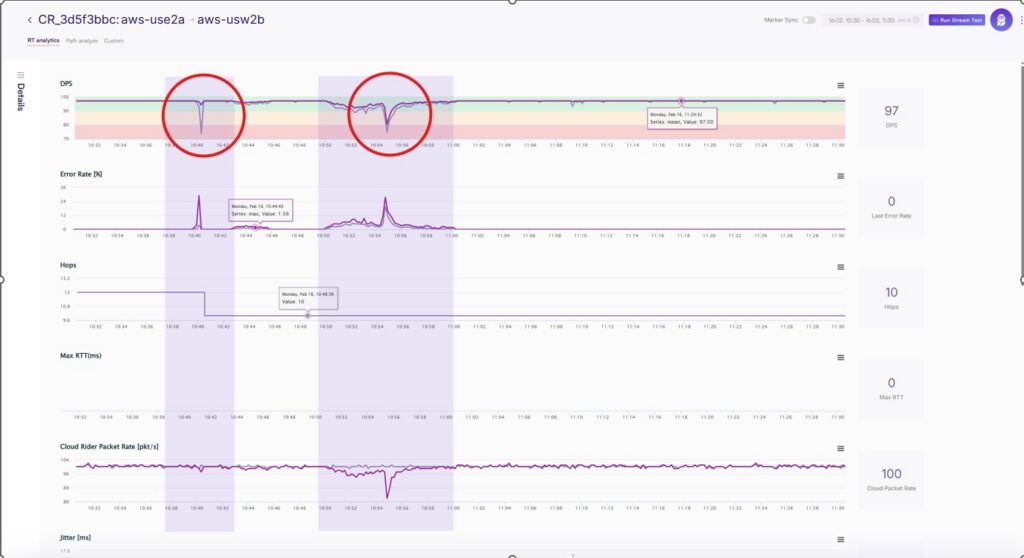
A series of cloud-provider network anomalies hit Uplynk’s streaming platform. Standard monitoring stayed green, and no alarms were fired. Within seconds, ObservaNet localized the disruption upstream, and Uplynk mitigated the problem for its customers. The same data let Uplynk identify and contextualize the upstream fault and put concrete, actionable evidence in front of its cloud partner. That cuts the time to resolution and secured commitments to preventive measures, in place of a slower, more speculative escalation.AlvaLinks gives us route-level data, including IPs, paths, and hop-by-hop telemetry, the moment an issue is detected. It changes the conversation with every partner and vendor we work with”
— Shahar Mor, VP of Engineering, Uplynk (March 2026)
Integration
Fits your stack
ObservaNet adds a precision path-layer source to the tools already in place. No rip-and-replace.
REST API
Integrates with NOC dashboards, ITSM platforms, and alerting systems.
Feeds your AIOps, SIEM, and ITSM
ObservaNet supplies the path-layer signal that those platforms have been missing.
Integrates with AI-powered log management and network observability platforms
Paired with any such platform, ObservaNet’s data-path telemetry becomes root cause and prioritized action inside a single event stream. AlvaLinks and LogZilla have published a joint whitepaper on closing this gap.
— THE PILOT —
What will you find with ObservaNet?
KPIs are signed off at day 0, with weekly readouts alongside AlvaLinks engineering. The sensor pair deploys in one afternoon. Enterprise rollout phases by site cluster from there.
KPI 1
Detection time
How many seconds pass between a path-level event and an operator alert, measured across injected and natural failures.
KPI 2
Segment localization accuracy
Your own post-mortems validate the share of events correctly localized to ISP, SD-WAN, cloud, transit gateway, or hop range.
KPI 3
MTTR delta
Tickets triaged with ObservaNet evidence typically show an 80% to 90% reduction compared to those without it.
KPI 4
Operational cost per major incident
Engineering hours and bridge-call time recovered, measured against your own hourly cost.
KPI 5
Gray failures that no other tool detected
Counted, with path-anchored evidence attached to each, in your environment.
Questions engineers ask first
-
1. What is gray failure ?
Gray failure is a path or component the application experiences as broken, even though every health checks the system runs returns green. Microsoft's research team identified and named it in 2017 (Huang et al., HotOS 2017). It started in the cloud and now appears across networks that span multiple providers and segments.
-
2. What is DPS (Datapath Performance Score)?
DPS is AlvaLinks's algorithm that turns high-frequency path sampling into a per-application health score. It considers RTT, delay, packet error rate, and jitter, with compound thresholds set per application. A breach of the composite score triggers an evidence capture: the path, the segment, the KPI delta, and the offending hop range.
-
3. How is ObservaNet deployed?
Software sensors at both ends of a path, on Linux or Windows hosts. No hardware. Deploy as SaaS, on-premises for air-gapped environments, or hybrid. A sensor pair deploys in a single afternoon.
-
4. Does ObservaNet replace my existing monitoring tools?
No. ObservaNet augments the existing stack, adding the path-layer signal it has been missing. It feeds AIOps, SIEM, and ITSM platforms through a REST API.
See ObservaNet on your network
Bring us the incidents you normally close as "no fault found." We will show you where they live.